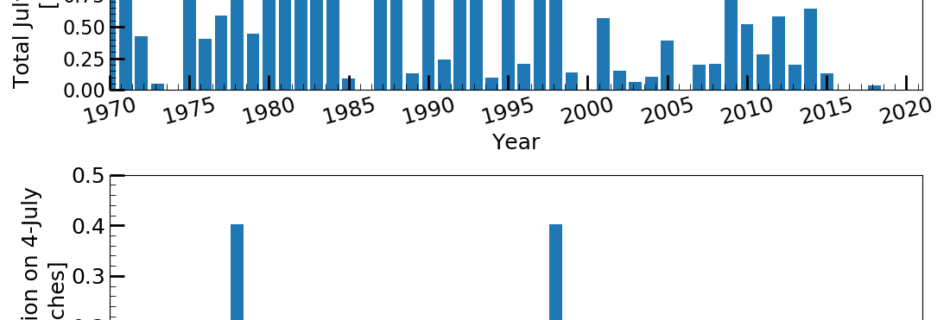
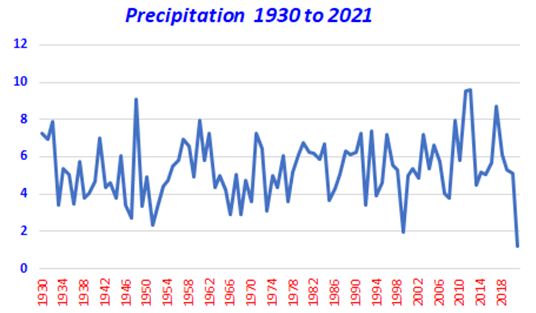
A very dry spring

If you have a hunch that this has been a very dry spring, then we may have some data to back you up. According to Bob Barry, a technician for CAF, “we are having the driest March + April + May since 1930, and, possibly since 1893.” The total precipitation for all of March through …

Measurements, and data, and more, oh my!

As more data begins to show up on the website (https://cafltar.org/data/) and with the reformatting of the Eddy Covariance Flux Tower Data dashboard, it behooves us to take a minute to explain the data being displayed and its potential usage from a researcher’s perspective. Today, the core meteorology data. The “research-grade” data and instruments will be …

Cold as Ice…

Given the sudden onset of some rather chilly (and snowy) weather; I thought it would be worth taking a quick look at how early Pullman experiences freezing temperatures. There are two metrics I’ll be looking at: the first day after July 1 where we record a minimum daily temperature (TMIN) below freezing and the first …

How pleasant is Pullman’s weather: A deeper dive

So, there were some conversations about doing the same pleasant day calculation but to take into account just the period of day when people are generally active. In part, this came from the discussion of the diurnal temperature range and the minimum temperature as they relate to the criteria used and from my own curiosity. …

Putting Pullman’s extreme April precipitation into a historical context

For those not in Pullman, early April was an eventful time for us, a lot of rain and even some flooding! For us weather nerds (i.e., the author), these types of events are fun and not fun at the same time. They are fun because they provide interesting data and neat pictures but not fun …