Our data manager was reading the internet one day and found a little post about how many ‘pleasant weather days’ there are across the country. After we discussed it a bit, we kept returning to the question of what constitutes a ‘pleasant day’ and how the total number of days has changed over the years. After asking a few friends their opinions, I can safely report that everyone has a different opinion of what a ‘pleasant day’ means. But! We must forge ahead and ask questions…Using one of the articles that inspired the idea, I decided to start with this same definition of a pleasant day to get a baseline for Pullman:
- Maximum temperature no greater than 85 Fahrenheit
- Minimum temperature no less than 45 Fahrenheit
- Mean temperature between 55 Fahrenheit and 75 Fahrenheit
- No precipitation or significant snow cover.
These criteria result in the Pullman/Moscow area having between about 30-50 pleasant days any given year. This has been relatively consistent over time, apart from a brief dip in the late 2000’s (Figure 1).
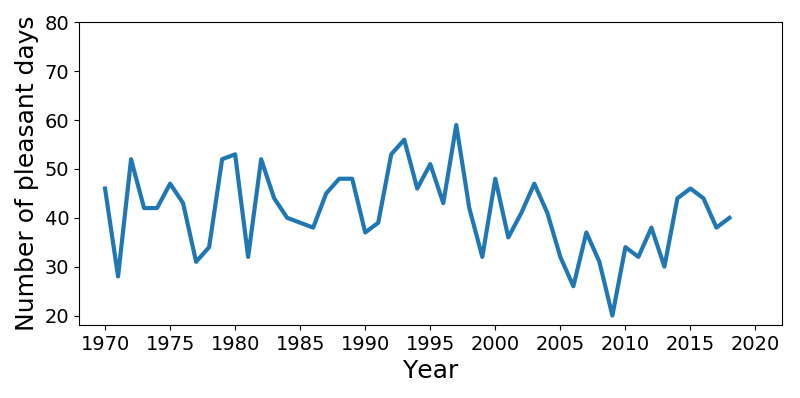
Figure 1: Number of pleasant days based on the climatological record from 1970 to 2018 in Pullman, WA using the original criteria.
However, having lived here for 7ish years, this number seemed low to me. This means it’s time to dig a little deeper and apply a little local climate knowledge to these criteria. A deeper dive into the Palouse region’s climate is warranted, but that is for a future post. Since these metrics were applied to the entire US, and there are many different climates across the country, a one-size-fits-all set of criteria might not be the best approach. How one defines a “pleasant day” depends heavily on personal preferences. The initial definition is a good starting point; however, I think the definition has a bias against climates with drier summers like ours that have large differences between the minimum and maximum temperatures. I am not saying the (occasional) few weeks of blistering heat in the summer or frigidness in winter is pleasant, but we are penalized for the wrong reasons…*puts on professor and meteorologist hats…*
One of the criteria is that the minimum temperature for the day must be above 45 Fahrenheit (F). I am not going to argue too hard against this limit because 45F is a bit chilly, but there is a technicality to address. With our climate (for the curious; Koeppen classification of Dsb), our average minimum temperature (Tmin) is consistently below 45F from about mid-September (DoY 240-270) until late April to early May (DoY 110-140; Figure 2).
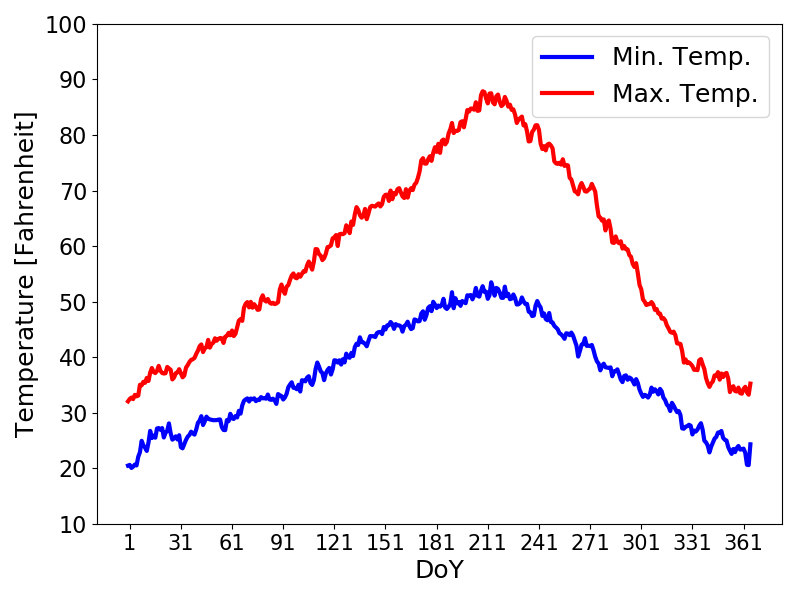
Figure 2: Average minimum and maximum temperature over the course of the year based on daily values from 1970-2018. The x-axis uses day-of-year (DoY) with January 1 represented as DoY 1 and counting by one for each day.
Granted, as autumn progresses, between the rain and decreasing daytime temperatures, I do agree that many of those days are not that pleasant…but I think there are many pleasant days in April, even late March, that run afoul of the Tmin criterion. More on this later, but first, a brief science interlude:
During the summer, the Tmin typically occurs between about 3:00am to 5:00am because it takes time for the surface and atmosphere to cool after sunset (Figure 3).
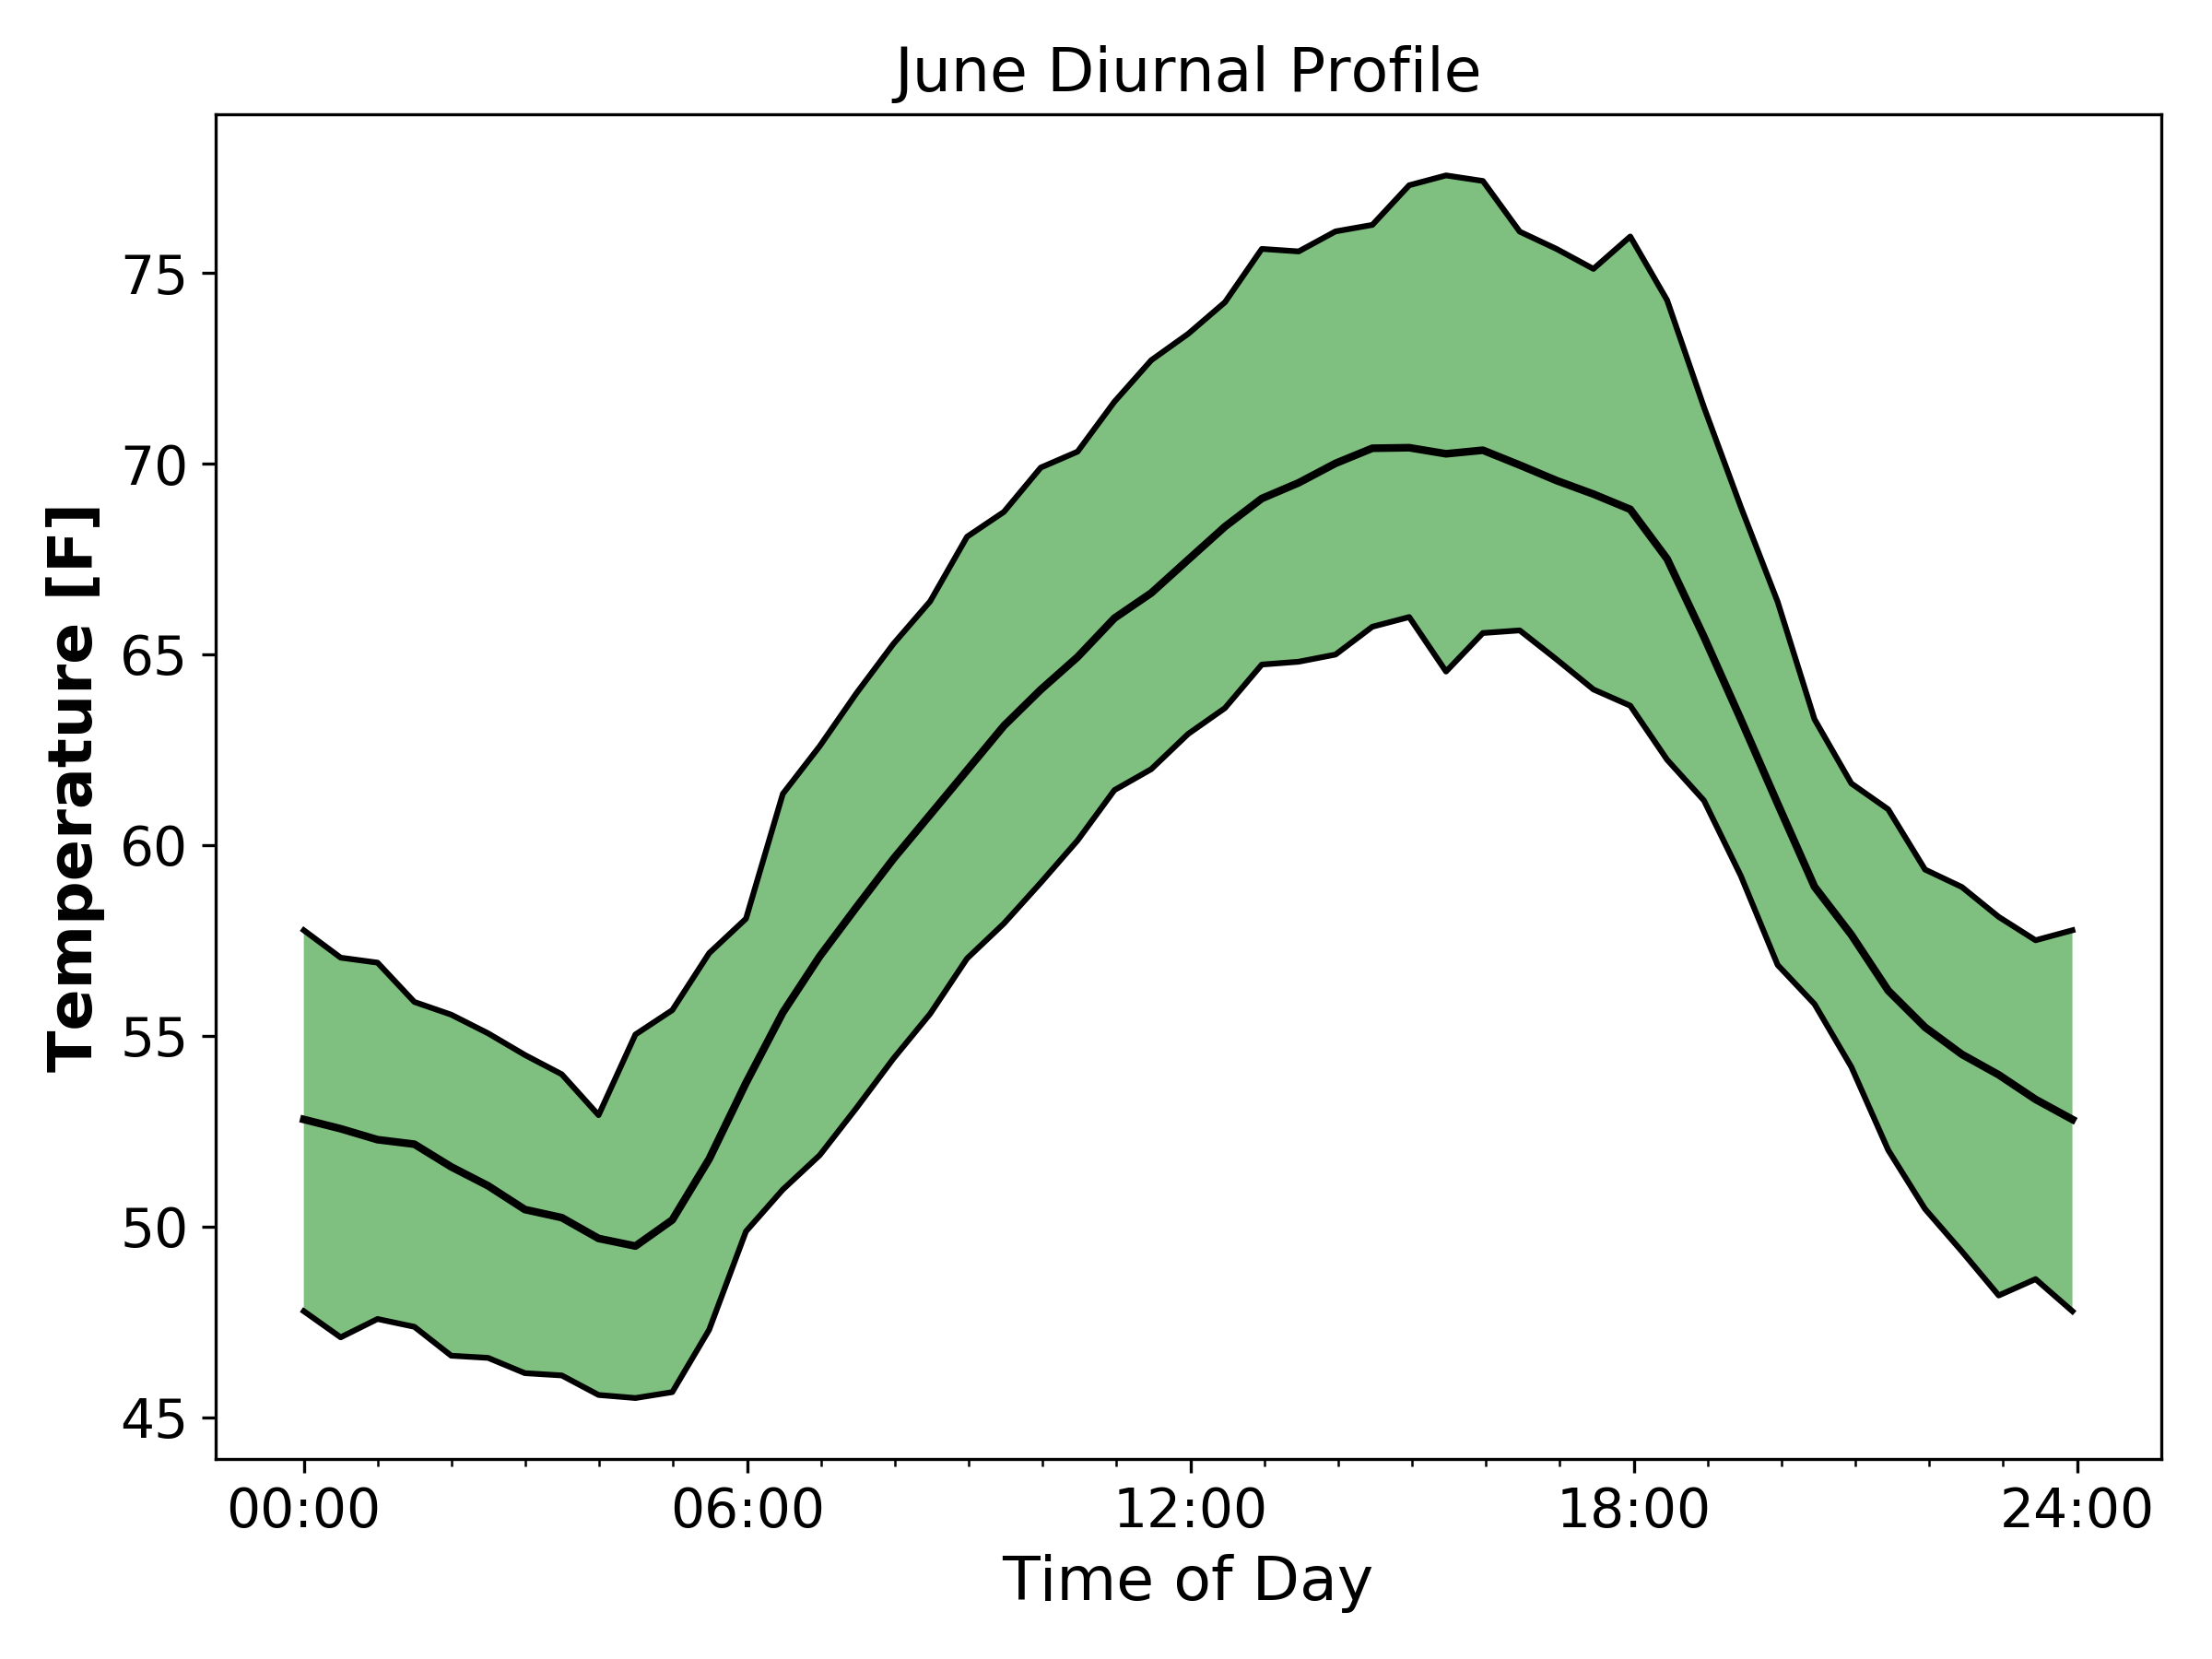
Figure 3: Example of diurnal temperature for entire month of June 2019. The shading is the 25% and 75% quantiles of the range of temperature.
Past this time, the heat loss by the earth reaches an approximate equilibrium with the amount of incoming heat, and, not long after, sunrise brings a return of positive heating. The reverse helps explain why the maximum high temperature occurs during the late afternoon (~3:00-5:00pm) the surface needs enough time to heat up and reach an equilibrium with incoming and outgoing heat. Both of these reasonings depend on the amount of sunlight and cloudiness of the day. The overall cloudiness of our summers is relatively low, so the clear nights result in generally cooler overnight temperatures and larger temperature swings between day and night. Nights with clear skies tend to be cooler than nights with clouds since clouds can act as a ‘blanket’ of sorts, keeping in some of the heat. During the day, this effect reverses, with cloudy days tending to be cooler than sunny days, all other things being equal. Around here, all these effects combine to generate an average difference between daily maximum to minimum temperature of 20-30 degrees Fahrenheit, if not greater (Figures 2 and 3)!
Most of the pleasant days in Pullman (Figure 4) tend to occur in late May through June (Day of Year 140-180) and again in September (Day of Year 244-270).
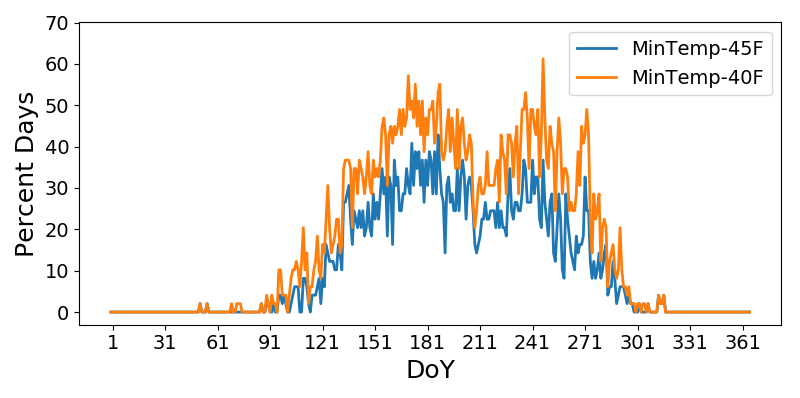
Figure 4: Percentage of the total 48 years that each day-of-year was considered a ‘pleasant day’ using both 40F and 45F as the minimum temperature criterion. The higher the percent, the higher the number of days that satisfied the ‘pleasant day’ criteria.
I argue that April through mid-May (Day of Year 100-140) contain a number of pleasant days (when it is not raining) and so does early October (Day of Year 274-290). With those additions, I think Pullman should have closer to 60-70 ‘pleasant’ days over the course of the year. In fact, lowering the Tmin limit to 40F increased the number of pleasant days to the 50-70 days per year range (Figure 5, top panel)! Not meeting the maximum temperature (Tmax) criteria only negates 35-40 days a year (Figure 5, bottom panel) during summer and we can all agree on those days being just too dang hot.
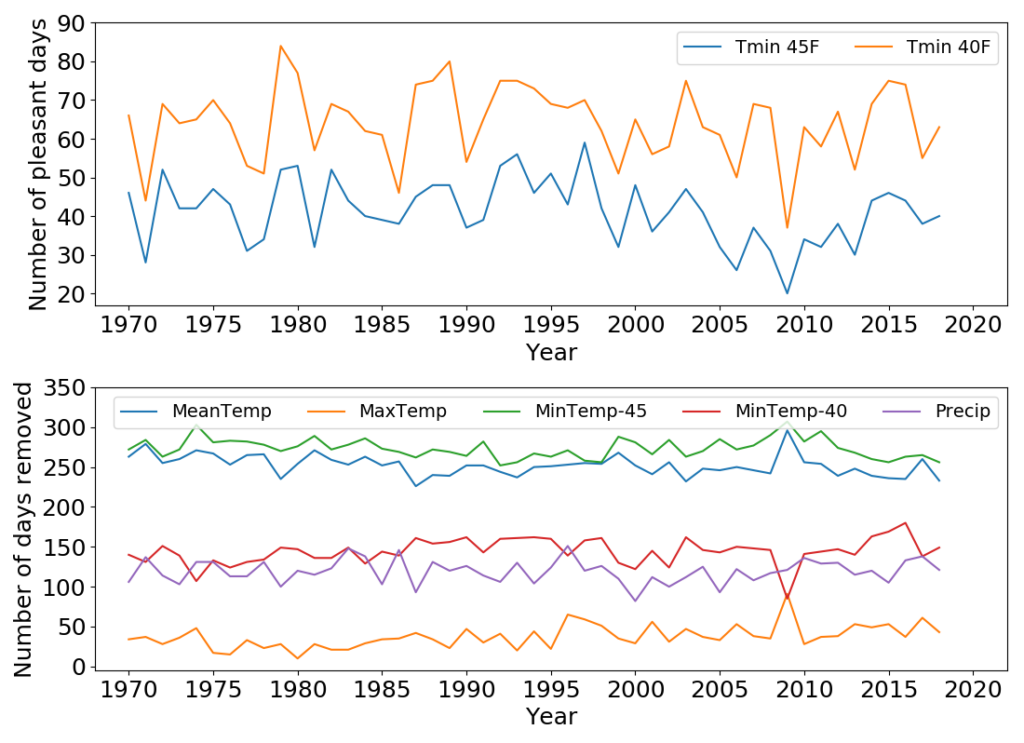
Figure 5: Top panel: Number of pleasant days based on the climatological record from 1970 to 2018 in Pullman, WA using both 40F and 45F as the minimum temperature requirement. Bottom panel: Number of days excluded from the total number of pleasant days for each day based on the different criterion. A day can be eliminated by violating multiple criteria at once so the total days removed per year for each year totals more than 365.
Therefore, maximum temperature is not a large factor and given the general timing of the precipitation in the area, the other criteria are unlikely to be satisfied during the rainy periods. The biggest reason for a day not passing the ‘pleasant day test’ in the Pullman/Moscow area is the Tmin is too low, followed closely by the mean temperature (Mean temperature = (Tmin+Tmax)/2). Some would argue 40F is too cold for pleasantness but since it is happening in the early morning hours and not mid-day, that argument is not that strong. Most of the friends I have talked to prefer it being a little cooler than warmer anyway. Lowering the maximum temperature cut-off would also drop the number of pleasant days during the summer but I think 85F is a perfectly pleasant maximum temperature, and since this is my post, I get to make the rules. What constitutes a pleasant weather day will always be subjective, but I think most can agree, even with the potential drawbacks, these general criteria are a very good starting point, but like most things, context is always helpful.
***
Editors note: Eric has clearly illustrated that the “pleasant day” index conveys poor information when applied to locations with large differences between min and max temperatures. From that, he has identified a need for a true “pleasant day” index — that is, apply the criteria to the actual day. Or, even better, to times when people are active; perhaps 8 AM to 8 PM? This, of course, requires more data as we’ll need hourly instead of daily. But such things don’t scare us!
Stay tuned. We are investigating how best to explore these ideas.
***