For those not in Pullman, early April was an eventful time for us, a lot of rain and even some flooding! For us weather nerds (i.e., the author), these types of events are fun and not fun at the same time. They are fun because they provide interesting data and neat pictures but not fun because of the damage they can cause. A more detailed write-up of the events that caused the flooding is warranted but here I want to delve into the climatology of precipitation in April for Pullman to see how rare (or not rare) these types of events are and how this April stacks up against Aprils of the past. First; a quick review of the precipitation received in April, 2019.
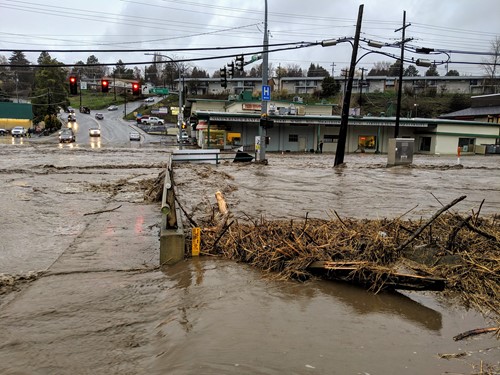
The Palouse has a Mediterranean-based climate, experiencing hot and dry summers with wet winters and springs so we are not unaccustomed to a little bit of rain this time of year. The climate normal (1981-2010) precipitation for Pullman for April is 1.73 inches; just shy 10% of the total year’s precipitation (20-21 inches). This year, there was measurable precipitation (typically defined as >0.01 inches of rain but also including days with “trace” precipitation) every day from April 3 to April 13. During this 10-day period, Pullman received 3.42 inches of rainfall according to the Spokane National Weather Service office (NWS). That is two Aprils’ worth of precipitation within the timeframe of only half an April. The biggest event was on April 9, with 1.2 inches of recorded rainfall on that day alone, the same day the flooding occurred. Since April 13, there has been only a handful of rainy days (defined here as days with measurable precipitation) but none of the daily rainfall totals did not approach the same level experienced at the start of the month.
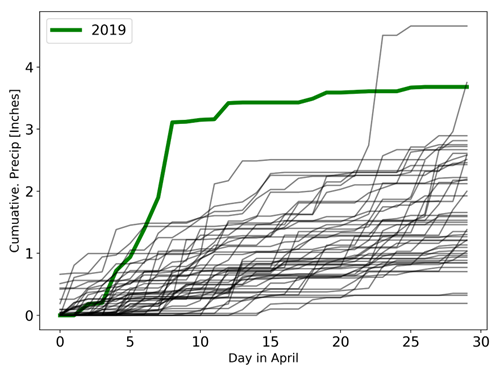
So how did this April stack up against the historical record? Let’s start with precipitation record for April from 1970-2018 using data from the National Centers for Environmental Information (NCEI) and with preliminary data from this April from the NWS climatology. Plotting the cumulative totals over the month, we see that 2019 ranks as one of the wettest months for Pullman in the last 40 years at 3.65 inches of precipitation. The two wettest years since 1970 were 1996 (4.66 inches) and 1993 (3.75 inches), with this year ranking a close third. What is interesting is all three of these years had multiple larger rainfall events (>0.5 inches of rain per day) that bumped up the total.
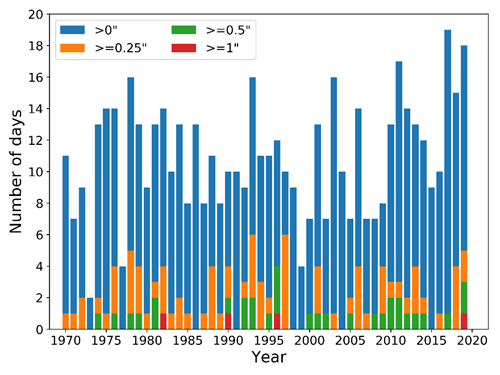
But how often do those larger rainfall events occur? To answer that I broke the precipitation data into four categories: days that experienced more than 0 inches, 0.25 inches, 0.5 inches, and 1 inch of total precipitation. The number of days with more than 0 inches of precipitation is the total number of days rain was recorded in Pullman. Including 2019, there have only been 4 days in April in the last 39 years to experience more than 1 inch of precipitation! On average, in April, Pullman only gets about 0.15 inches of rain on rainy days (total monthly rainfall divided by the number of days with recorded precipitation). Interestingly, April, 1996 had a near-average number of rainy days (i.e., days with recorded precipitation) at 12 compared to the 39-year average of 11 rainy days per month; it just happened to have a day with more than an inch of rain and three more days with over 0.5 inches of rain, contributing to over half the total April 1996 rainfall. The year with the most rainy days in April was 2017 with 19 of the 30 days having measureable precipitation but only an average amount of rainfall. This year’s April came close to matching 2017 with 18 days recording some amount of precipitation.
But wait…there’s more! We have data that goes allllllllll the way back to 1893 when the first precipitation records were established near Pullman. At this point in history, Washington State University was only three years old (founded in 1890), and just one year younger than the state of Washington (admitted as a state in 1889). Word of caution, the older the data, the generally less reliable it can be because of technological changes and record keeping strategies and there is no guarantee of the accuracy. There are a number of missing years from 1910-1930 but from the entire precipitation record there was only one year wetter than 1996: 1958 with 5.04 inches! Over the whole record, 2019 only stacks up as the 5th wettest April since 1893, coming in behind (from wettest to driest) 1958 (5.04 inches), 1996 (4.66 inches), 1917 (4.21 inches), and 1993 (3.75 inches). While this April was certainly wetter than normal, it was only the 5th wettest April on record, but one of the rainier Aprils in the last 39 years.
